IoT with Texas Instrument CC2650 SensorTag
Overview:
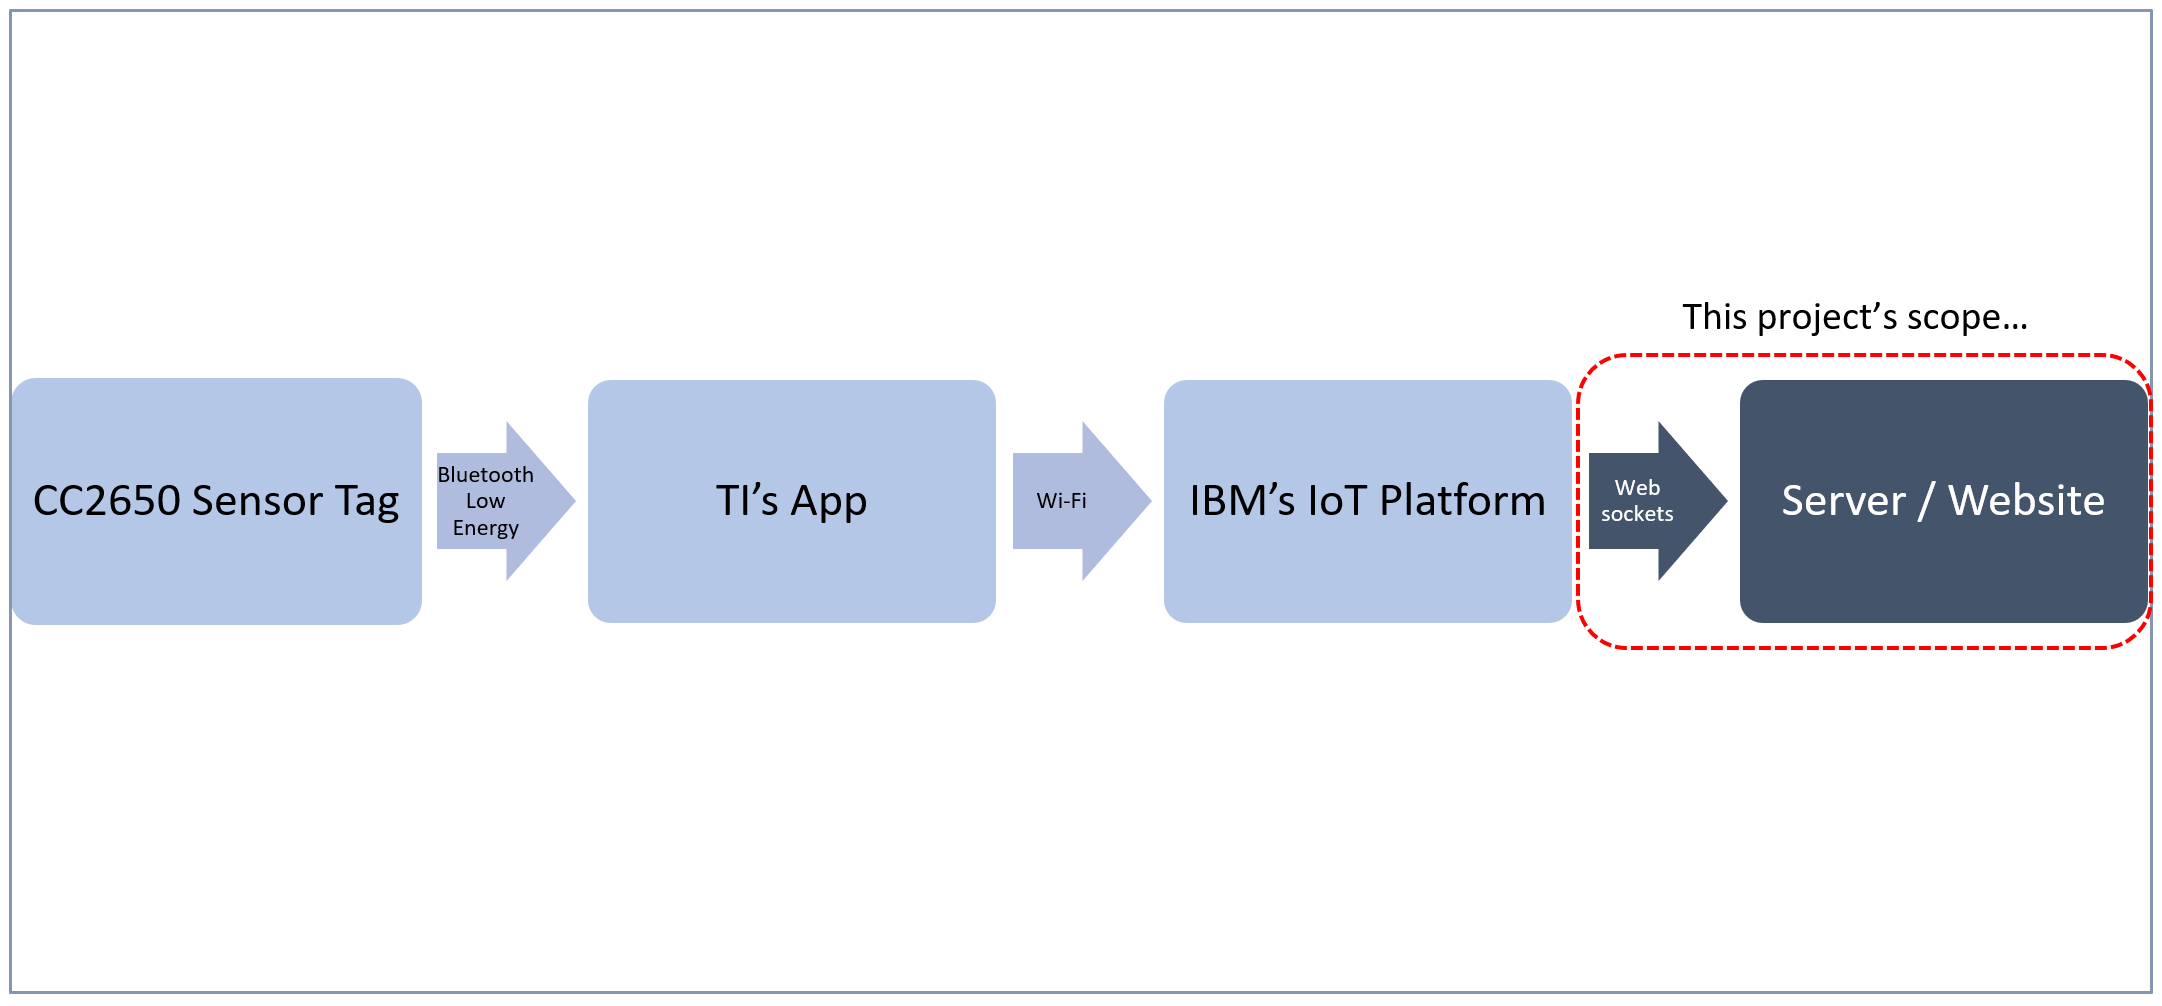
Texas Instrument’s CC2650 SensorTag is a sensor that captures real world data such as acceleration and temperature and allows for quick IoT programming. The SensorTag is easily configured to connect over bluetooth to your phone via a downloadable TI SensorTag App. The app displays the captured data freely to the user, and also allows you to forward that data to IBM’s Quick start server via wifi with a switch of a button. IBM’s platform can then be used to analyze the data as well as write and host our IoT application. However, in this project, Node-Red and Websockets are used to pull the data from IBM’s website and display it in our own website. The below digram shows and an overall view of this demo and the part this project is focused on.
How it Works:
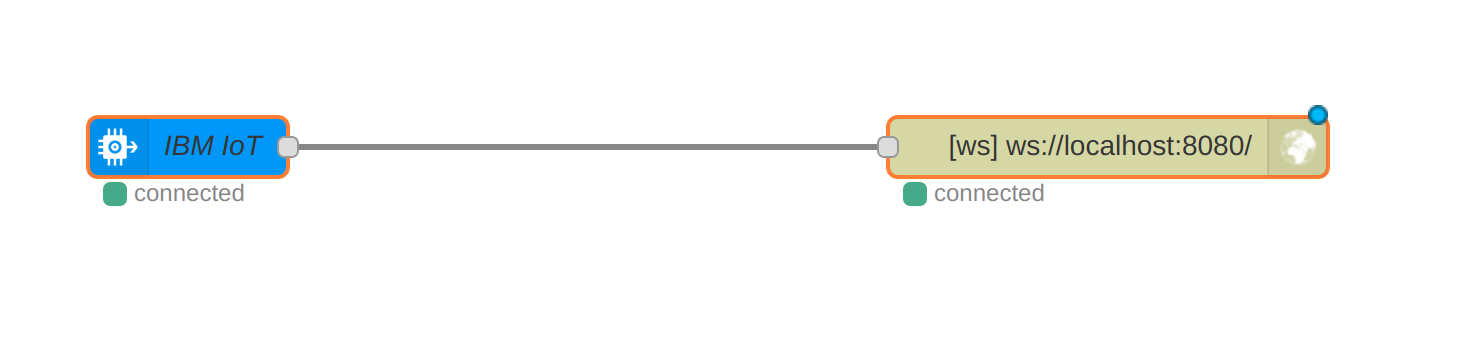
Node.js is used as my server and integrates Node-Red - a programming tool with a graphical interface that allows you to just connect programming objects like a flow diagram. To retrieve data from IBM’s platform in Node-red, I mainly use then ibmiotapp module, and then connect that to my websocket module which sends the data to my server. The server then forwards that data via websockets to my website where the raw values are displayed using some simple javascript, css, and html. Google Charts is also used in my website to graph the x, y, and z acceleration data in real time. This project is available on github and a demo is available on youtube.
Hardware:
- Texas Instruments CC2650 SensorTag
- SmartPhone with “TI SensorTag” Application
- Laptop running Linux (Ubuntu OS)
Software/Modules:
- Node.js
- Node-Red
- BootStrap
- HTML, CSS, JavaScript
References:
Texas Instrument’s CC2650 SensorTag
Node-Red
Websockets
ibmiotapp
Google Charts